What 2025’s Marketing Data Actually Tells Us About Move-Ins

In senEvery year, we look at performance numbers. Occupancy rates. Inquiry counts. Tour volume. But those numbers don’t always answer the question operators really care about:
Is our marketing actually driving move-ins?
Our 2025 Year-End Benchmark Report set out to answer that directly.
The Problem: Most Benchmark Reports Don’t Tie Marketing to Move-Ins
CRM document systems are built to store files, not to support dynamic, modern engagement. They function There are plenty of benchmark reports in senior living. Many focus on occupancy rates. Others focus on inquiry volume. Some focus on sales performance inside the CRM. But very few tie marketing activity directly to verified move-ins.
Occupancy is a state. Move-ins are a measurable outcome.
If marketing teams are going to make confident budget decisions, the question cannot simply be “Are we full?” It has to be:
What marketing activity is actually driving move-ins?
Without that connection, it becomes difficult to determine which channels warrant more investment, which need refinement, and which may be overcredited.
The Insight: 2025 Was a Strong Year, and the Data Proves It
When we analyzed full-year 2025 performance across communities, several trends stood out:
Move-Ins Continued to Climb
Normalized average monthly move-ins continued to grow year over year. While move-ins do not mirror occupancy exactly, they broadly track with industry recovery trends and finished the year strong.
Marketing Qualified Leads Increased
New Marketing Qualified Leads, defined as the first inquiry from a person within the collective buyer’s journey, continued to grow across the year. Re-inquiries and follow-up engagement also remained strong.
Sales Qualified Leads and Engaged Prospects Improved
More prospects progressed into the CRM as Sales Qualified Leads. Even more importantly, engaged prospects, those with completed sales activity, increased, indicating stronger alignment between marketing and sales follow-up.
Tours Remain a Powerful Indicator
One of the strongest conversion indicators remains tours to move-ins. Communities that effectively convert inquiries into tours consistently see higher move-in rates.
Speed-to-Lead Matters
The data reinforced what many operators suspect: faster response times correlate with stronger move-in performance. Communities that engage prospects quickly outperform those that delay follow-up.
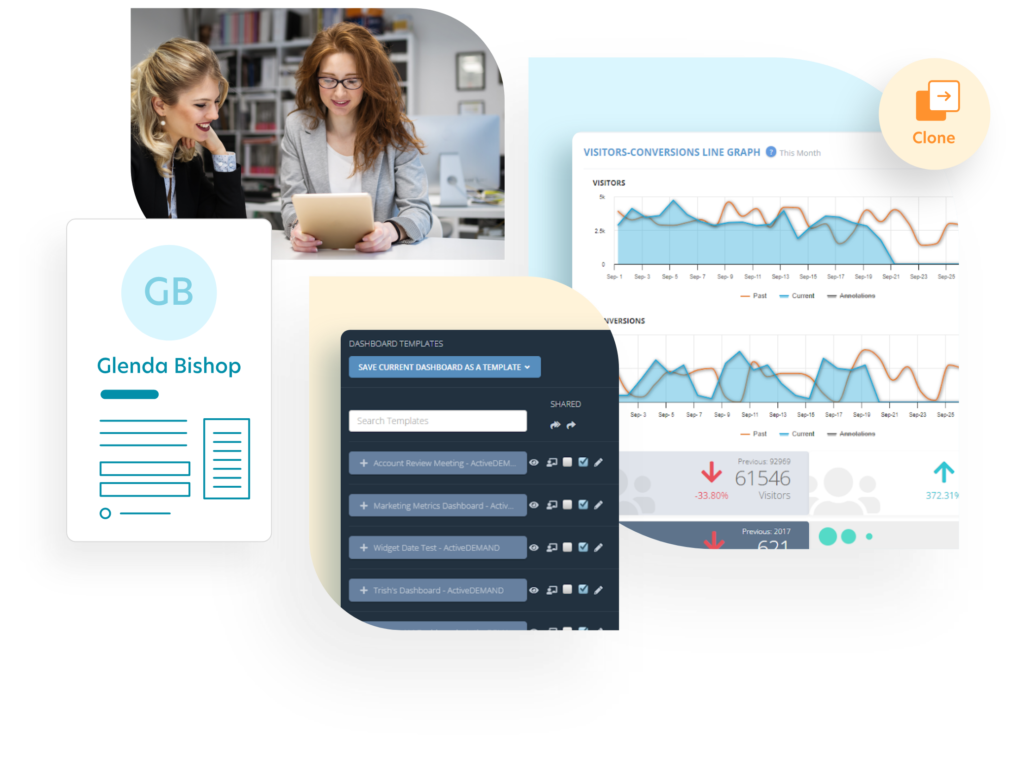
The strength of this benchmark report lies not only in the trends. It is how the data is collected.
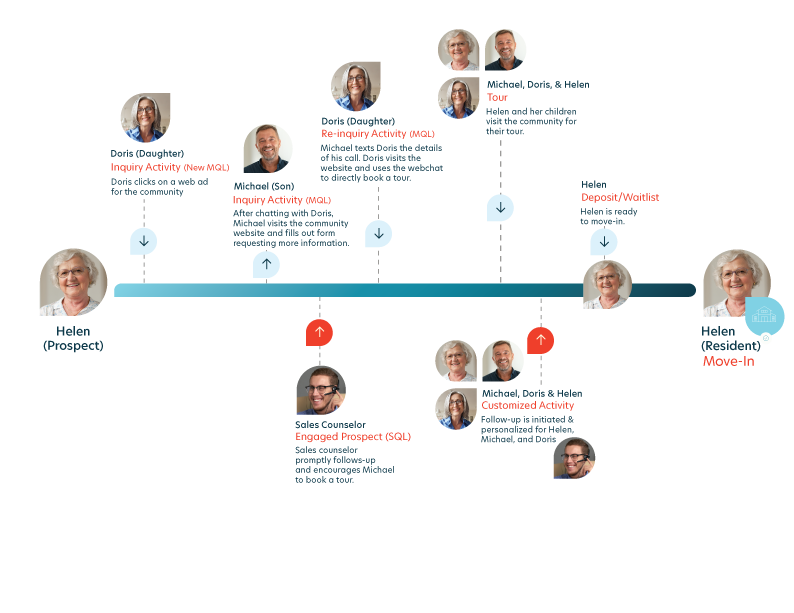
Instead of starting measurement at the point of “engaged lead” inside the CRM, this analysis tracks the entire journey:
- Anonymous website visits
- Ad engagement
- Content interaction
- Inquiry activity
- CRM prospect creation
- Sales engagement
- Tours
- Verified move-ins
Using a collective buyer’s journey model, attribution is not limited to a single person. It reflects the shared journey of residents and their influencers, which is especially important in senior living, where decisions involve families, adult children, and other stakeholders.
This approach allows marketing performance to be tied directly to verified move-in outcomes, not assumptions.
By measuring first-touch attribution across the full funnel and correlating it to successful move-ins, communities gain clarity into what is truly influencing results.
Why It Matters: Better Data Leads to Better Budget Decisions

Content Cards Instead of Attachments: Sales teams share clean, branded links instead of bulky PDFs. When you understand what is driving move-ins, everything changes.
You can:
- Allocate budget more confidently
- Improve speed-to-lead processes
- Focus sales energy where it matters most
- Identify which channels deserve expansion
- Reduce reliance on guesswork
Why It Matters for Senior Living Operators
Families expect a seamless digital experience. Sending outdated attachments feels disconnected from how people consume information today. Clean, trackable links build confidence and make engagement easier.
For operators, the impact is operational as well as strategic:
- Less labor managing documents.
- Stronger brand consistency across communities.
- Clearer visibility into what content drives tours and move-ins.
- Better collaboration between marketing and sales.
The difference between average performance and pacesetter performance is not luck. It is visibility.
Communities that track full-funnel activity and verify outcomes against move-ins can refine their marketing strategy with precision. They are not reacting to occupancy fluctuations. They are proactively shaping their pipeline.
2025 proved that marketing performance is measurable. The next step is to use that measurement to guide the 2026 strategy.
Ready to Learn More?
👉Download the full 2025 Year-End Benchmark Report to see the complete data breakdown and performance ratios.
📅 Book a Demo and see which marketing activities are truly bringing families to your community.
